Local Elections 2024: Independents and No Party Majority gain ground … what will that mean for the main three parties in the general election…..?

Take a break on us as we take an in depth look at the changes in the Local Councils at the 2nd May local elections..
Following on from the local council elections held on 2nd May 2024, we have taken a look at the overall results and summarise some interesting observations.
The recent local elections in England have brought about a significant shift in the political landscape, with the Conservative Party facing setbacks across various regions.
The Conservatives lost ground, losing almost as many councillors as they managed to retain. Notably, they found themselves trailing behind the Liberal Democrats, landing in third place.
Labour emerged as a clear winner in these elections, securing over 1,000 of the 2,660 council seats up for grabs.
The Conservatives’ losses were further compounded by the defeat in the Blackpool South by-election, where Labour triumphed.
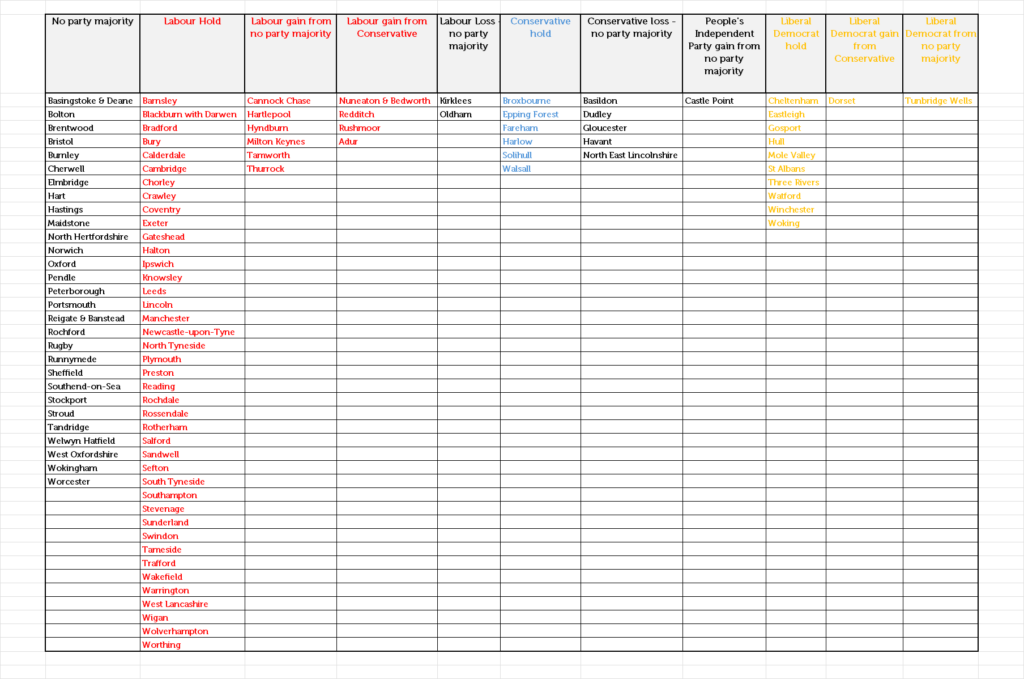
Table 1 highlights the changes within each local council.
Table 1

Chart 1 shows graphically the number of councils gained or lost by the main parties and also that 30 of the 107 Council’s where elections were held the resulted ended up with no party being in overall control (about 28% of the total number of Councils), which perhaps highlights the general malaise (or apathy) being experienced by some voters in relation to the ‘offer’ of the three main parties…

Chart 1
Across the country, 20 councils saw changes in control, with Labour’s successful bid to gain control in areas including Milton Keynes and Hartlepool. The Liberal Democrats made notable gains, securing control of councils in Tunbridge Wells and Dorset.
Basildon and North East Lincolnshire councils now find themselves without a single party in control, as the Conservatives lost seats in both areas.
Table 2 list the Council’s where there has been a change in control:
| Council | Result | Previous Control |
| Adur | Labour Gain | Conservative |
| Basildon | No party majority | Conservative |
| Cannock Chase | Labour Gain | No Overall Control |
| Castle Point | Peoples independent party gain | No Overall Control |
| Dorset | Liberal Democrat gain | Conservative |
| Dudley | No party majority | Conservative |
| Gloucester | No party majority | Conservative |
| Hartlepool | Labour Gain | No Overall Control |
| Havant | No party majority | Conservative |
| Hyndburn | Labour Gain | No Overall Control |
| Kirklees | No party majority | Labour |
| Milton Keynes | Labour Gain | No Overall Control |
| North East Lincolnshire | No party majority | Conservative |
| Nuneaton & Bedworth | Labour Gain | Conservative |
| Oldham | No party majority | Labour |
| Redditch | Labour Gain | Conservative |
| Rushmoor | Labour Gain | Conservative |
| Tamworth | Labour Gain | No Overall Control |
| Thurrock | Labour Gain | No Overall Control |
| Tunbridge Wells | Liberal Democrat gain | No Overall Control |
Chart 2 provides and overall assessment of the Council gains by part.
Whilst the Liberal democrat and Labour gains are evident, the number of Council’s with no overall control or with an independent party majority, suggest that the big three party’s may have their work cut out in gathering votes at a general election form those who may be apathetic or disheartened with the offer of the conventional three parties.

Chart 2
It is interesting to note the number of Councils that do not have any overall control, and with Labour emerging as a clear winner in these elections, it will now be all eyes to the general election to see how the parties and non-partisan representatives, perform at a national level…


